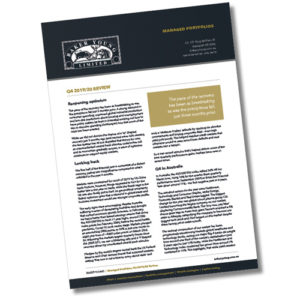
IMP Monthly Report | July 2021
The Australian share market rose 1.09% in July, extending its remarkable rally to a 10th consecutive month and equalling its longest winning streak in 52 years! (more on this later). This came despite NSW losing control of its COVID-19 outbreak and entering a protracted shutdown, which, along with other less substantial lockdowns in other states, is likely to result in a quarterly GDP contraction as recognised by the Reserve Bank of Australia’s statement this week.
From an IMP positioning perspective, we remain constructive, with cash levels sitting at 6.3% (lower end of our ‘normal’ 5%- 10% range) and we continue to favour reopening and value plays overgrowth (which has enjoyed a significant recovery in recent weeks). This is evidenced by our recent trades including adding QAN, KMD, and STO variously throughout our models… Continue through to the full report here.

The links below will take you to the July 2021 Holdings & Yield Forecast charts for each of our portfolios:
IMP 100I | a model portfolio designed to more for income than growth with the majority of the funds invested in the top 100 ASX listed companies
IMP 100T | a model portfolio designed to more for growth than income with the majority of the funds invested in the top 100 ASX listed companies
IMP 200 | a model portfolio designed with the majority of the funds invested in the top 200 ASX listed companies
IMP 300 | a model portfolio designed with the majority of the funds invested in the top 300 ASX listed companies
YMP | a model portfolio designed for income with the majority of the funds invested in the top 100 ASX listed companies
For more information about our Individually Managed Portfolios, contact us to speak to one of our specialists.
